Download Logfile
For support purposes, we may ask you to provide a logfile from your device. There are two types of logfiles:
Note
Support services are only provided to customers who have ordered from us. Please contact your dealer.
The Download Debug Logfile function downloads the logfile directly from the QuattroPod device.
With the Debug Over IP method, debug information is read via your network infrastructure using terminal software and saved into a logfile.
Download Debug Logfile
You need to enable the Developer Options and select the function Download Debug Log. Using the Advanced Settings feature, you can log in and download the logfile with any web browser.
Open Advanced Settings
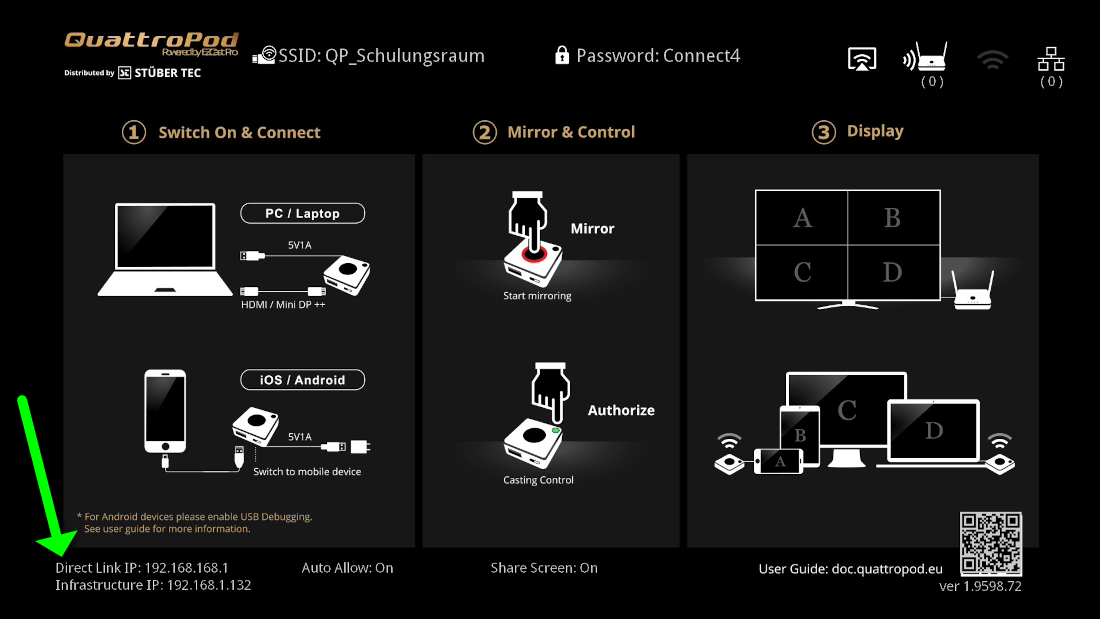
- Note the IP address shown at the bottom left of the home screen.
- Open your web browser.
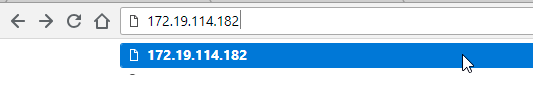
- Click into the browser's address bar and enter the IP address of the QuattroPod.
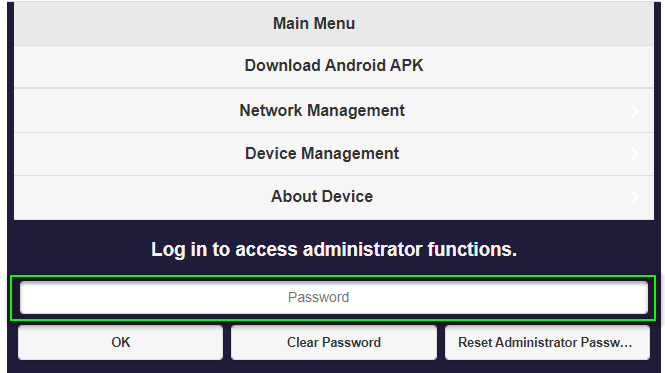
Log in as Admin
- Enter the admin password and click OK to log in. The default password is
000000. If this password is not accepted, reset the device using the reset switch.
Download Debug Logfile
- From the main menu, select
Admin Settings:
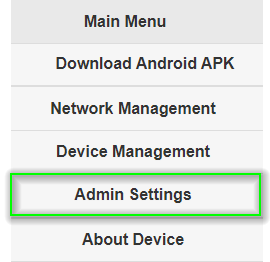
- Click nine times consecutively on the text
Admin Settings:
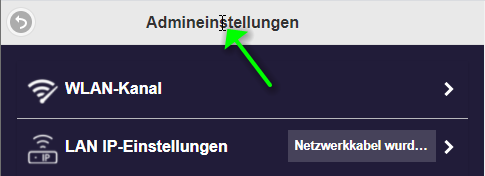
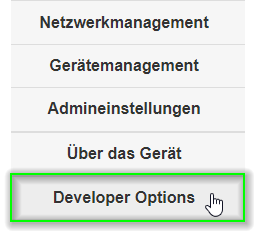
- Click
Back, then selectDeveloper Optionsfrom the menu:
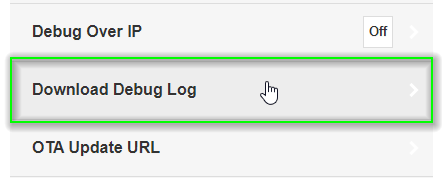
- Click on
Download Debug Log. A logfile will be downloaded:
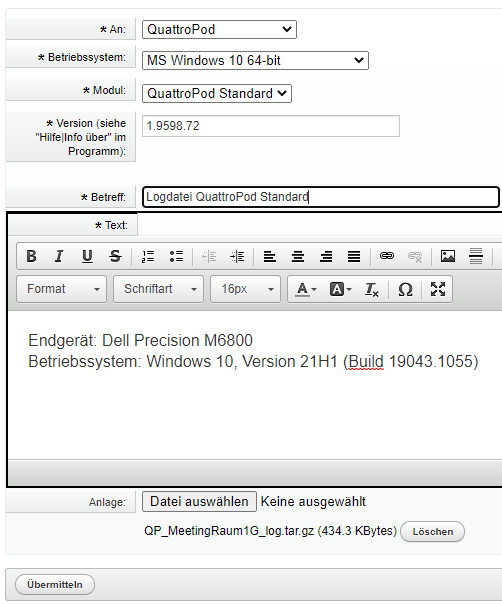
- Please send us the logfile via our ticket system.
Perform Debug Over IP
Here, you need to enable the Debug Over IP function and read the process information of the QuattroPod. The data will then be saved into a logfile.
Using the Advanced Settings feature, you can log in and download the logfile with any web browser.
Open Advanced Settings
- Note the IP address shown at the bottom left of the home screen.
- Open your web browser.
- Click into the browser's address bar and enter the IP address of the QuattroPod.
Log in as Admin
- Enter the admin password and click OK to log in. The default password is
000000. If this password is not accepted, reset the device using the reset switch.
Activate Debug Over IP
- From the main menu, select
Admin Settings:
- Click nine times consecutively on the text
Admin Settings:
- Click
Back, then selectDeveloper Optionsfrom the menu:
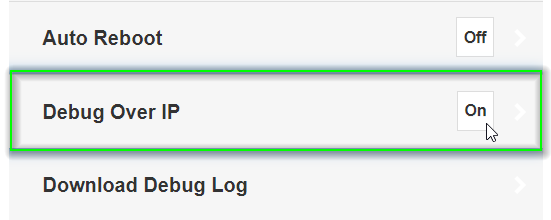
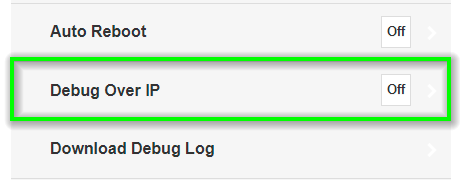
- Click the function
Debug Over IPto enable the network service. A logfile will be downloaded:
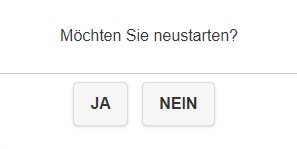
- To activate the setting, you need to restart the QuattroPod. In the
Admin Settingsmenu selectRestart.
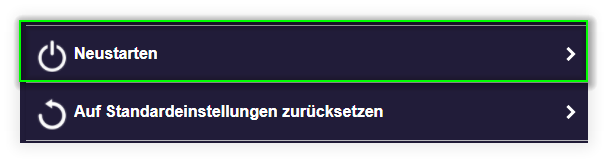
- Then click the
Restartbutton again.
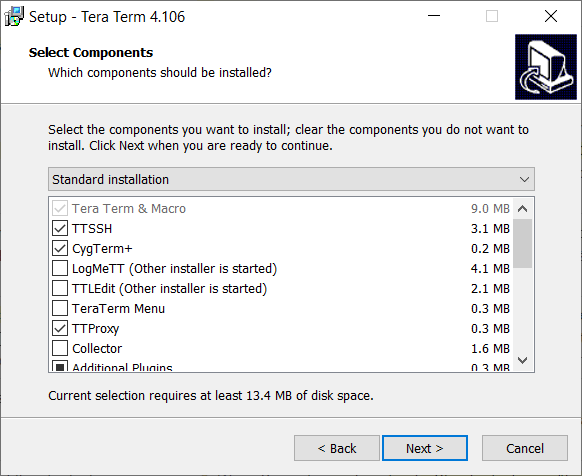
Download the terminal software Tera Term and run the installation package:

- You can accept the default settings:
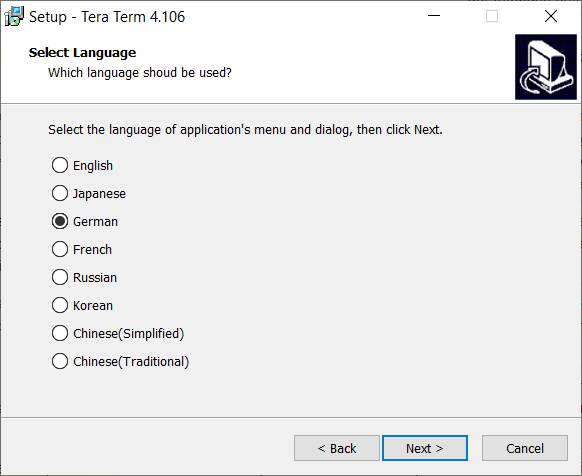
- Select your preferred language:
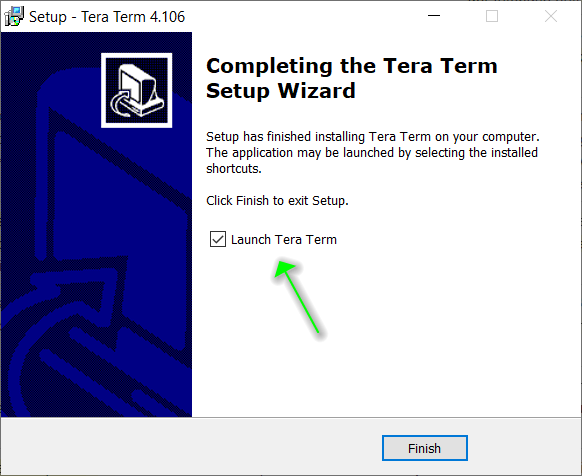
- At the end of the installation, check the box for
Launch Tera Termand clickFinish:
- Note the IP address shown at the bottom left of the home screen.
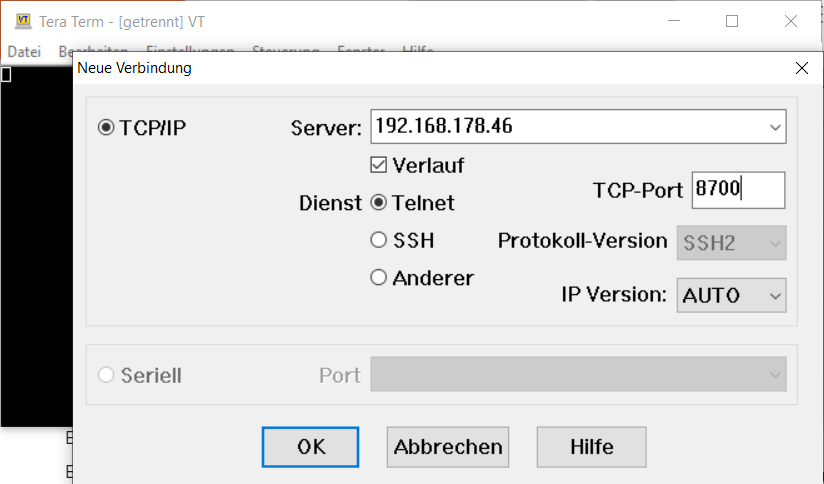
- In the
New Connectiondialog, enter the IP address of your QuattroPod device and the TCP port8700, and select the serviceTelnet. Your PC must be on the same network as the QuattroPod device:
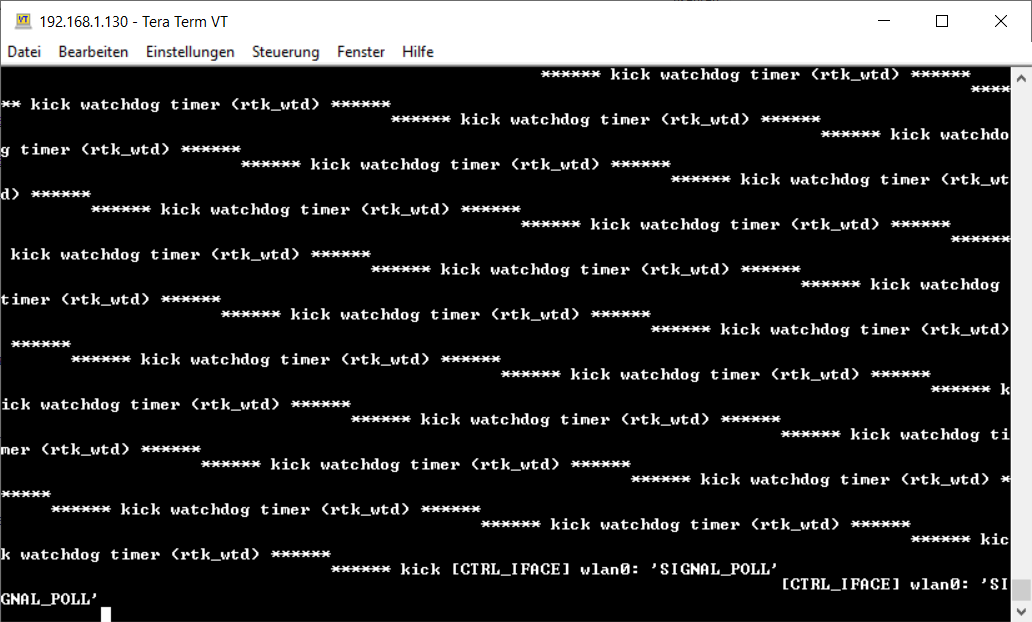
- If the connection is successfully established, the process information will be displayed in the Tera Term window:
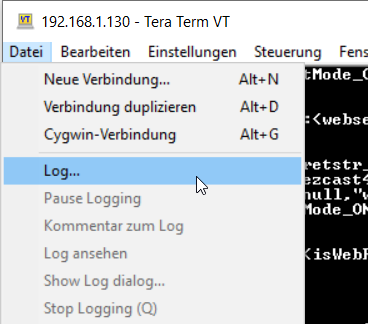
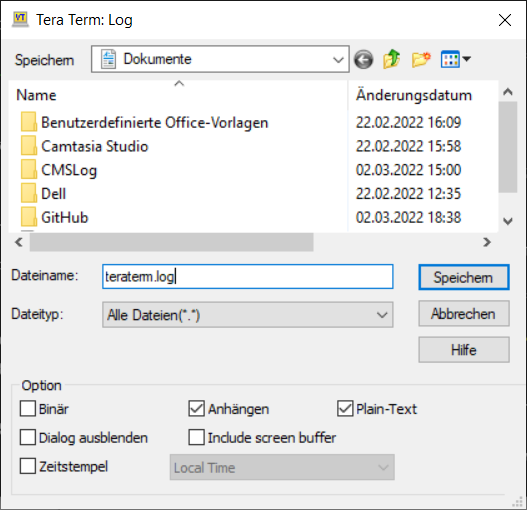
- Under
File->Log..., save the logfile in theDocumentsfolder:
Note
At this point, all activities of the QuattroPod are logged. Now reproduce the events that caused the problem, e.g., perform touch gestures on the screen until the issue reoccurs and is recorded in the logfile.
- Please send us the logfile via our ticket system.
Deactivate Debug Over IP
- Finally, at the end of the procedure, you can deactivate the Debug Over IP function:
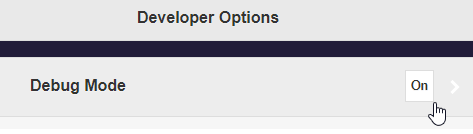
- To hide the
Developer Optionsagain, click theDebug Modefunction. You will return to the main menu: